A Go-To-Market (GTM) motion is a strategic plan implemented by a company to introduce and promote a product or service in the marketplace.
This encompasses every aspect of the customer journey, from initial awareness to post-purchase engagement and aligns marketing, sales and customer success.
A well-defined GTM motion leverages insights from market research, customer behaviour analytics, and competitive landscape evaluations to inform product positioning, messaging, and distribution strategies.
Harnessing data can help provide a holistic view of your business performance and optimise your GTM motion.
This means collecting data from numerous sources and using analysis to guide and empower data-driven decision-making.
As Jeff Ignacio, Head of GTM Operations at Regrow Agriculture, shared:
“You want to operate in an environment of data to ensure that data is driving your strategies, decisions, insights and GTM motion. You need to take the guesswork out of business and take calculated risks.”
“The powerful thing about insights is that you get to look at the data, understand and assess the opportunities or threats, and communicate that to your business partners.”
That means creating a data-driven culture and mindset in your organisation. Let's look at this in more detail. 👇
The benefits of data-driven strategies
Often, GTM leaders rely on gut feelings and intuition rather than facts to make decisions. However, your GTM motion and strategies must be as accurate and targeted as possible.
Creating a data-driven strategy reduces the risk of errors by replacing guesswork or assumptions. This improves conversation rates, revenue growth and operational efficiency.
This also enables organisations to allocate resources more effectively and pivot or optimise when necessary in response to market changes.
In fact, data-driven organisations are three times more likely to report significant improvements in decision-making.
As Sid Kumar, Senior Vice President of RevOps at HubSpot, explained:
“I think being targeted and focused about what you’re using your data for and how it’s helping you connect your go-to-market strategy with your customers is essential.”
“But you sometimes have to accept that data will never be perfect. There’s no such thing as ‘perfect’ data; as soon as it becomes perfect, usually it’s outdated and stale.”
“So it’s how much data you need to get a conviction as a company that you’re taking a calculated set of risks and bets to go after a market.”
Creating a data-driven strategy: Interpreting your data
1. Descriptive analytics
Historical data provides a retrospective view of a business’s performance and GTM strategies. It highlights any notable patterns, trends, and fluctuations.
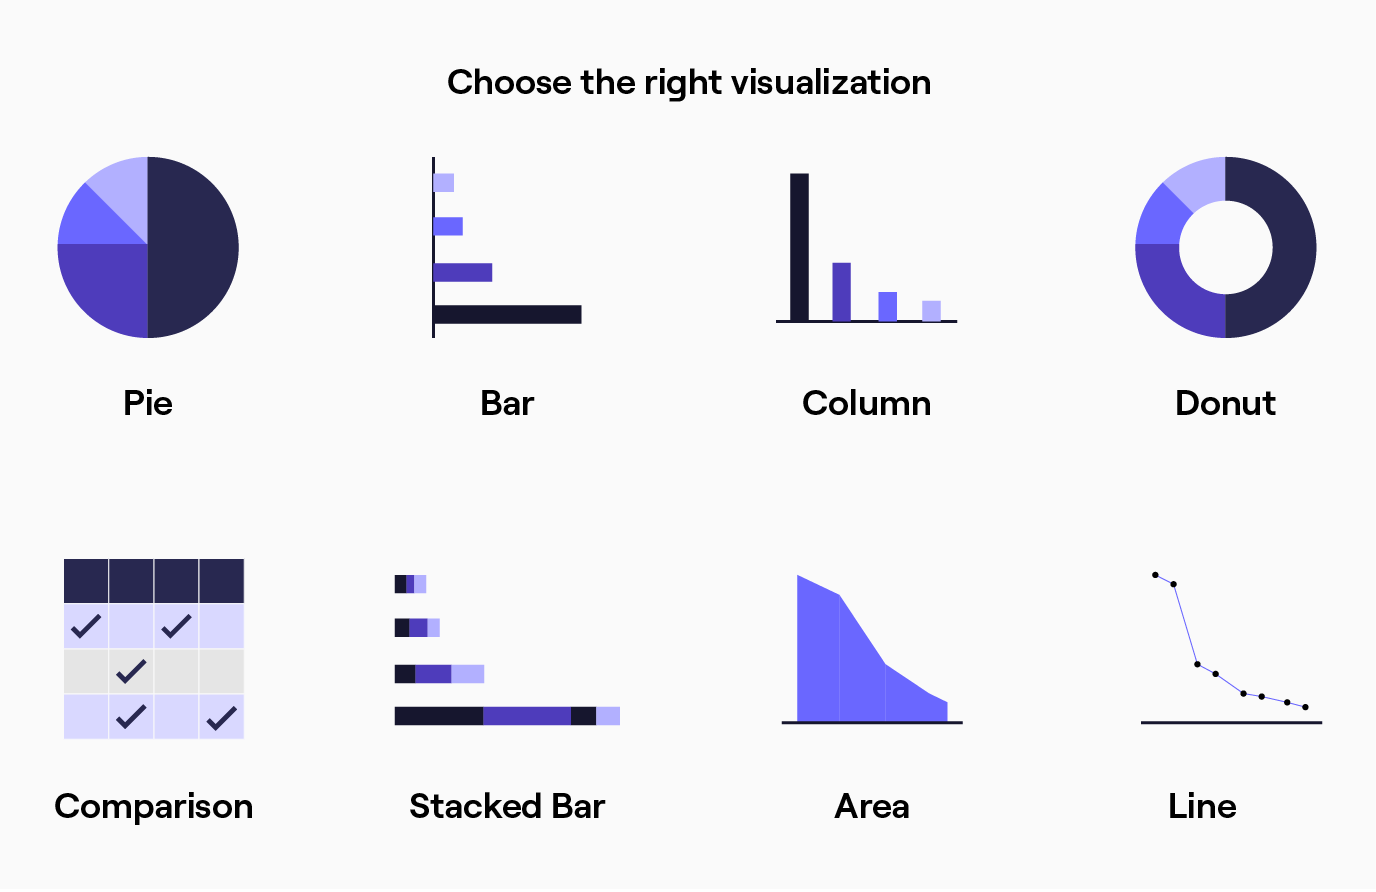
Dashboards, reports, and data visualisation tools can help understand conversion rates, customer acquisition costs, revenue growth and other key revenue-related metrics.
This data-driven analysis informs an understanding of what has worked and what aspects of your GTM motion need improvement.
Attribution models and historical marketing performance data allow organisations and marketing teams to understand the impact of different marketing strategies, campaigns and channels, for example.
Assigning value to each touchpoint in the customer journey ensures that resources and budgets are invested in the most impactful areas.
Sales data lets you understand which product demos, presentations and value propositions are the most effective at converting different prospects across various data points to improve your GTM positioning and messaging.
Regression forecasting models also use historical data and linear regression techniques to identify relationships between dependent and independent variables.
Through this analysis, you can understand how certain factors in your sales process affect your sales performance, what is going well and what might need to be adapted.
You can go into your CRM and analyse how many opportunities your sales team have created and how many have converted. From there, you can open up some interesting coaching opportunities.
You can examine whether you’re delivering your messaging correctly, whether your prospects align with your ideal customer profile, and whether you’re cold calling them at the right time.
You can then start working with enablement around coaching and begin to understand your golden hours. According to your data, these are the hours when you would have a higher propensity to connect if you were to call.
That way, your sales reps can strike when the iron is hot. In the hours when you don’t have high connection rates, you can organise your team meetings.
This is just one example of how data-driven analysis can improve your efficiency, sales strategies, and GTM motion.
However, not every decision requires 100% of data. As Jeff shared:
“The idea is to make sure you nail the decision correctly grounded in data. But, if you did that for every decision, you could probably slow down your decision-making.”
“That’s why you need to differentiate between one-way and two-way doors. Two-way doors and easily reversible decisions, whilst a one-way door means reversing will be very painful to the business and could cause significant harm.”
2. Predictive analytics
Predictive models leverage historical sales, marketing and product data analysis to inform data-driven strategic planning.
Here, statistical algorithms and machine learning techniques help identify patterns in customer behaviour and marketing dynamics to forecast future trends and outcomes.
This enables businesses to be proactive, identify potential areas for revenue growth, predict customer behaviour and optimise each aspect of their GTM motion.
As Andy Mowat, Vice President of GTM Operations at Carta, shared:
“We have the ability in RevOps not just to be reactive but also proactive and a strategic partner. A key part is data and bringing insights into the conversations.”
“We built a data warehouse with the right analytics and team. Then we were able to answer a lot more questions and create a lot of metrics that we couldn’t before.”
Predictive models can include decision trees and neural networks. These can inform sales forecasting, as organisations can more effectively predict future revenue streams.
Predictive marketing analytics can optimise pricing strategies. By analysing historical data and market trends, machine learning algorithms can indicate which pricing patterns generate the most successful outcomes, which can then inform your data-driven pricing strategy.
This enables sales teams to offer the most profitable yet competitive pricing options, maximising revenue and improving conversion rates.
Understanding what products customers are most likely to purchase and analysing customer preference data can inform intelligent product recommendations and configurations, improving upsells and cross-sells.
This also improves personalisation, as predictive analytics leverage customer data, purchase history, and behavioural insights to personalise quotes that meet the customer’s needs.
Businesses can also optimise resource allocation by using predictive models. For example, they can retarget online ads to potential customers with data that predicts a greater likelihood of conversion and purchase intent.
This efficiency ensures that resources are directed toward areas with the highest returns, contributing to sustainable growth and ROI.
3. Data experimentation
Data insights also allow businesses to experiment with different business strategies.
This can include landing pages, ads, pricing, onboarding costs and customer advocacy programmes to shape your GTM motion and strategies.
Here, you can analyse each version's performance against performance—and revenue-based metrics to optimise your data-driven strategy and approach.
Leveraging collected sales data and experimenting with various communication methods can help continually refine your SaaS GTM strategy.
For example, suppose most of your pipeline is from small businesses, and a significant proportion of these accounts aren’t closing due to your access or onboarding fee.
In that case, you can recognise a pattern: your upfront costs might cost you revenue.
By removing the access fee and assessing the retention value after 12-24 months, you can evaluate whether the revenue from renewals and increased closed rates outweigh the revenue loss from the access fee.
You could also conduct A/B tests to improve your bounce rate by testing different variations, including product description changes or design features on your website.
This data-driven analysis helps identify friction and visitor pain points, improving your visitors’ experience and eliminating guesswork in your GTM decisions and strategies.
4. Segmentation
Gathering data is valuable, but interpreting it requires segmentation. Segmentation involves dividing account-related data into different groups and customer bases.
These can be based on demographics, behavioural data, and past interactions to provide detailed insights into specific customers within a database.
Segmenting your opportunities allows you to assess which territories your global sales team are making the most impact in.
By segmenting your data sets into key business regions, you can perform full data analysis and optimise your GTM motion’s processes, messaging, and enablement.
For example, your marketing teams can enhance their account-based marketing strategies and email campaigns. With smaller pockets of segmented data analytics, organisations can tailor their strategies to meet the needs of different customer groups and their target markets.
This enables B2B companies to create personalised campaigns and messaging that target customers are more likely to resonate.
These can be based on their purchasing behaviour to improve customer interactions and increase engagement and MQLs.
Segmentation also allows you to identify which verticals have higher retention rates and lifetime value, enabling organisations to tailor product offerings based on the customer behaviour and characteristics of those verticals.
Technology plays a critical role in segmentation. Organisations can collect and process data quickly and efficiently with advanced analytics tools and marketing automation platforms to inform their data-driven business strategy.
5. Customer journey mapping
Understanding your customer journey across the entire GTM motion is crucial, and mapping out the various touchpoints and interactions can help identify opportunities for improvement.
You need to define the customer journey on two axes:
- The experience you want your customer to have throughout their interactions with your business.
- What the business needs to see to make informed decisions about what is and isn’t working.
Once businesses define this, they can use a data-centric analysis to uncover pain points in the customer journey, understand the actions and impact at each stage, and implement targeted data-driven strategies and solutions.
Key metrics to look for include conversion rates at each stage of the sales pipeline, the time it takes for leads to move past each stage and your win/loss rate.
This can help understand if specific customer segments are dropping off at distinct points in the customer journey.
Remember to map out the end-to-end GTM process, including purchase renewal and expansion.
Then, look internally and repeat the process. Map out the strategy, people, processes, technology, data insights and enablement across those touch points. Look for gaps or areas for improvement and figure out what is working and what is not.
Bottlenecks could occur as a result of poor lead routing, for example. Leads require different approaches based on their industry, product interest or preferences.
If leads are routed to the wrong reps or at a delayed rate, this could slow down your sales processes or cause prospects to drop off.
Instead, you can establish lead routing criteria to direct leads to the correct representative based on their strengths and weaknesses.
Dedicated enterprise sales teams can direct larger companies, or leads can be routed based on product or industry, ensuring that salespeople are knowledgeable about their specific industry use cases.
Customer segmentation data-driven analytics also help identify which high-value customers are more likely to be upsold or cross-sold and improve the customer success cycle.
By recognising when customers get maximum value from a product, businesses can strategically introduce additional offerings that complement their current usage.
You may also be interested in building a compliant GTM tech stack.
Understanding different data sets
1. Gathering your data
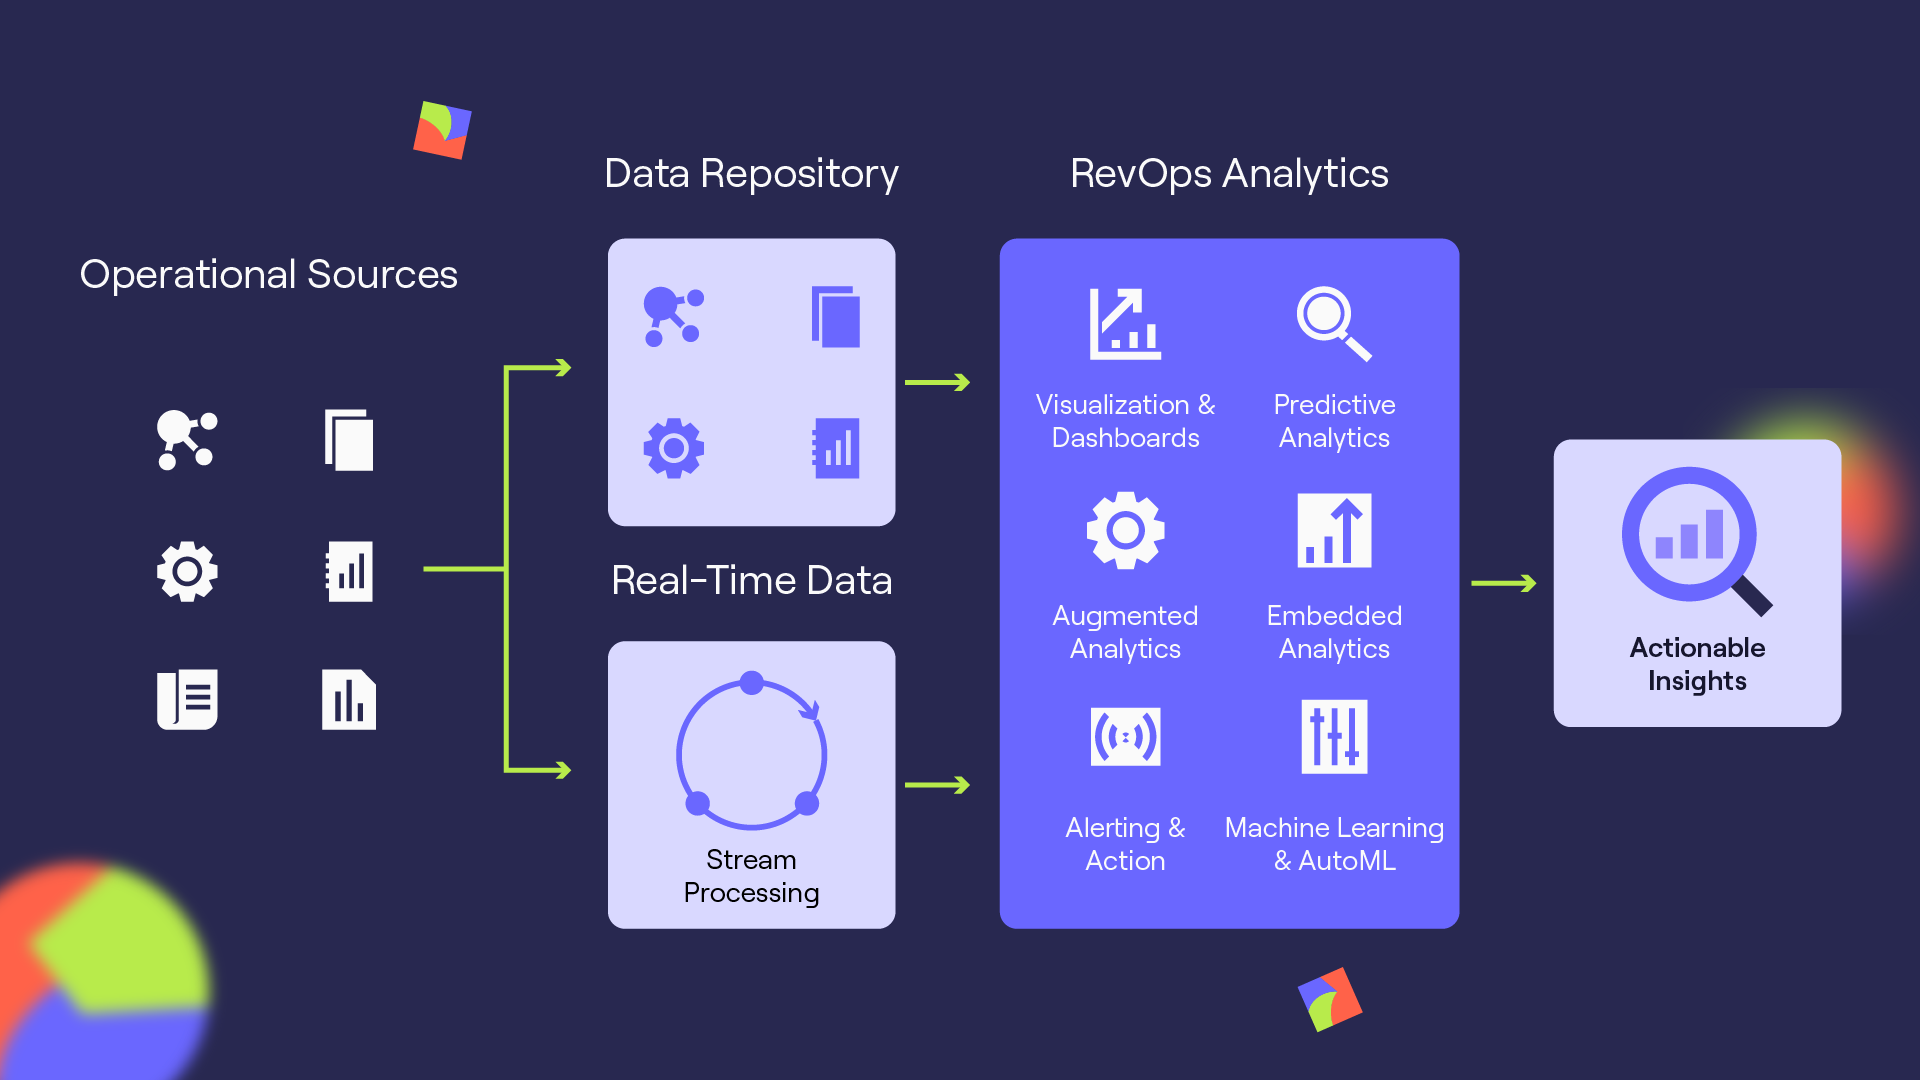
The first step to creating a data-driven strategy is to gather relevant data from various sources. Internal databases, customer feedback, and market research contribute to a comprehensive dataset.
Cleaning and preparing data involves removing duplicates, addressing missing values, and ensuring consistent data quality.
This also involves integrating data from various sources, such as CRM systems, marketing automation platforms, and customer support tools.
This is crucial, as Jeff shared:
“As a Head of Revenue Operations, I’m going to my product team, and I’m saying: I need to have these product signals flash to my go-to-market teams to determine the right go-to-market play. This will drive your GTM motion.”
“But often, the data is locked away in some product database. And the go-to-market team is likely ill-equipped to get that data, shift it from the product database, and have it sit in the CRM.”
Tools like dashboards, spreadsheets, and graphic software help transform the data into a usable format for data-driven analysis.
Combine quantitative and qualitative data to draw sensible conclusions. This holistic approach to data analysis ensures a better understanding of customer experiences and preferences, leading to improved sales strategies.
Haris Odobasic, Head of Revenue Operations at Greenomy, said:
“Ultimately, the missing piece for every good customer health score is the qualitative input when talking to the client. Then, you have the data view and what the client is saying. And if you combine both, you can build it into the customer health score.”
“We ask, how is the product usage? Did we talk to the decision-maker in the last quarter? Did the decision maker open the emails we sent them in the last quarter? Are they engaging with marketing emails?”
“And then all of these factors ultimately determine if they will renew. The health score was a way better predictor of renewal than a net promoter score.”
It is also important to look at leading indicators that focus on future outcomes rather than solely relying on lagging indicators that look at past results.
Leading indicators, such as customer retention rates, provide a more comprehensive understanding of a company’s performance and enable proactive decision-making.
Data analysis and visualisation are essential to extracting insights and identifying patterns, trends, correlations, and anomalies in your GTM motion.
2. Customer data
Behavioural data provides insight into customer patterns while interacting with products and services. This includes website browsing and purchase habits, device usage, and preferred purchase times.
These customer insights help businesses understand the preferred purchase times and which customer segments are most profitable.
Descriptive data includes customer information such as contact details, profession, and location.
This data forms the foundation for personalised marketing strategies tailored to specific demographics.
Firmographic and behavioural data can also determine a company’s most valuable customer and ICP.
Your ICP guides downstream efforts and tailored go-to-market plans. This helps align teams across your GTM motion and ensures you focus on the highest-value prospects, enabling companies to create scalable and repeatable strategies to engage and convert top accounts.
3. Market data
Market data delves into the broader market and business environment. This can uncover any untapped markets or territories you can expand into. Ben Dyson, Sales Operations Manager at Cognism, explained this:
“We use data to inform our decision-making processes. A good example is doubling down on where we see fruitful returns. We have launched Cognism France and are seeing great success there regarding all the metrics we value as a SaaS business.”
This can also include competitor analysis, which analyses data and benchmarks performances, identifies market trends, and helps discover opportunity potentials.
Competitor analysis can help understand and identify any gaps in the market to improve your value proposition and GTM messaging, whilst analysing market trends can help organisations align their product roadmap with the anticipated needs of the market.
Surveys, interviews, focus groups, and customer observation contribute to market research and provide insights into market positioning.
4. Sales data
A data-driven sales approach involves collecting and using specific metrics to inform sales decisions, from lead prospecting to people management and churn reduction.
Looking at how likely leads are to move from each stage of the pipeline can reveal any bottlenecks in your sales process and identify stages where leads are dropping out throughout your GTM motion.
That way, businesses can look at accumulated data from underperforming sections to determine what prevented deals from progressing and improve these processes at distinct points of the sales journey.
Sales data can inform pricing strategies, for example.
High prices can drive customers away. To address this, sales data can be used to segment customers by different pricing points, helping to determine the ideal price range based on each group’s behaviour and demand.
Andy Mowat explained this:
“With real-time data, you can look at pipeline coverage and calculate how much pipeline you went into the quarter with and what you ended up winning. You can look at how that pipeline shifts or closes. Doing that creates the right dialogues and discussions.”
“Every week, we can look at how pipeline coverage was working, when it spiked or dropped, and ask, what happened?”
“A good example is when we’re in that initial conversation stage and putting our most aggressive pricing forward, and we haven’t gotten that down to a narrow range. That would cause your pipeline to swing. You can snapshot that data point at a specific point in time to demonstrate this to your sales leader.”
Historical sales data can help discover the purchase intent of your prospects. That way, reps can understand which prospects are most likely to convert and which fit the criteria of your buyer persona.
Data insights can highlight any design, balance, and efficiency problems, enabling organisations to align sales activity with sales potential and results.
This enables sales leaders to focus efforts on accounts with the highest potential and ensures an equal distribution of workload and potential, maximising productivity.
This can drive both your decision-making, GTM motion and data-driven strategies.
5. Product and customer health data
Beyond sales data, product data covers the entire product lifecycle, incorporating customer feedback and requirements.
Businesses can determine underutilised areas of their product using real-time product data to gain insights into usage patterns and feature preferences.
Customer health metrics such as frequency of product usage, user engagement, and overall satisfaction scores allow businesses to quickly identify shifts in customer behaviour and improve customer engagement. As Ben Dyson explained:
“At Cognism, we amalgamated various usage metrics into one score that spits out a number between 0 and 100%.”
“By looking at historical data, we have seen that this directly correlates with retention rates. This gives us actionable outcomes to improve each component of the full score to improve our retention rates.”
Proactively monitoring for indicators of customer pain and dissatisfaction, such as decreased usage or increased support ticket submissions, will enable businesses to address concerns or pain points before they escalate and improve customer loyalty.
You can then offer personalised recommendations and tailor communication strategies to individuals. As Haris Odobasic shared:
“There’s a lot of opportunity to leverage product usage data. When you see a customer is not using a certain feature of your product, there’s a real opportunity to educate them or connect them to a marketing email to explain the unused feature.”
“By guiding and training them, I think there’s a big opportunity to drive adaptation, upsells, marketing opportunities and customer satisfaction and improve customer relationships.”
Other metrics, such as product adoption rate, measure the performance of new product launches, features, and updates. This can inform your product marketing team and guide operators when refining products and services.
6. Financial data
Financial reports, profit statements, and cash flow analysis enable operators to monitor the business’s financial health.
By examining revenue streams, cost structures, and profit margins, revenue operators can make data-driven decisions to enhance overall financial performance and inform data-driven strategies.
36% of marketers say one of the top reasons they leverage data is to justify spending by analysing marketing performance across different channels and campaigns.
This can ensure that you invest resources in the most impactful areas throughout our GTM motion and improve operational efficiency.
For example, calculating the cost of acquiring a new customer can help inform your budgeting.
By comparing CAC to customer lifetime value, revenue operators can determine the profitability of their customer acquisition efforts, ensuring that marketing and sales expenditures align with the long-term value of acquired customers.
Data-driven strategies: Key takeaways
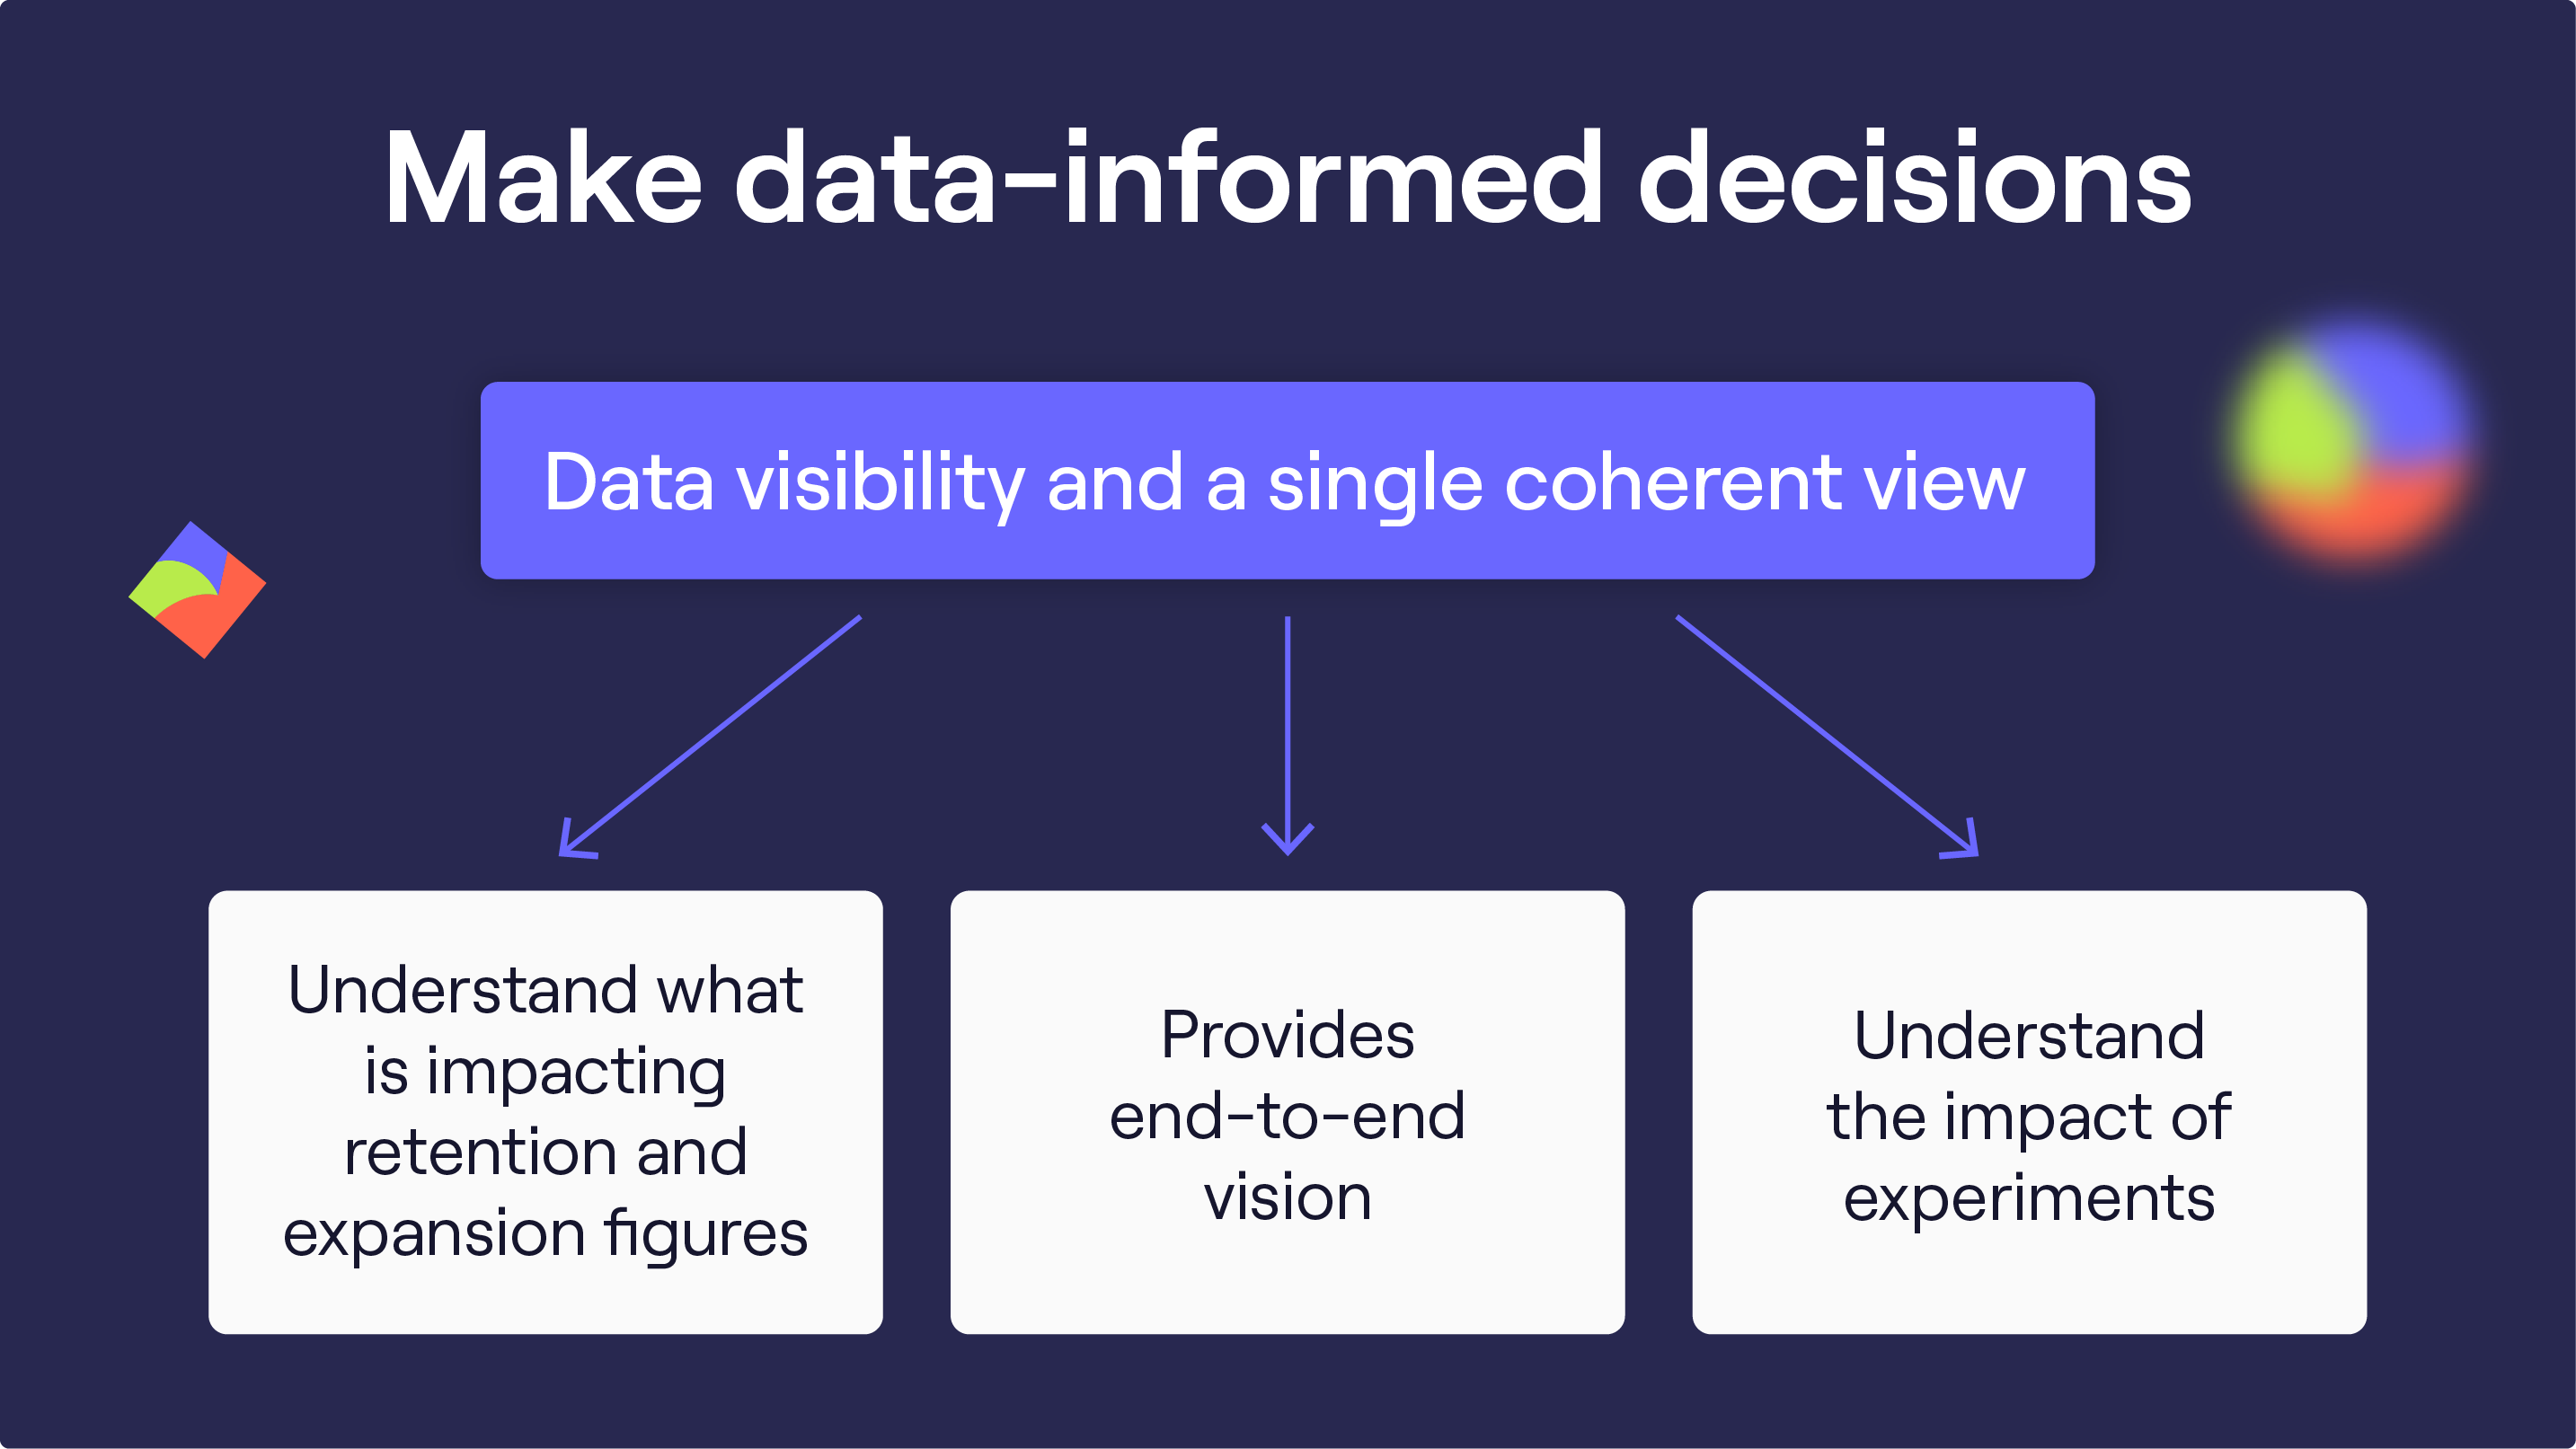
A data-driven GTM approach takes the guesswork out of strategic business decisions and reduces the risk of error by basing decisions on evidence rather than intuition.
Data-driven analysis helps identify any bottlenecks in your current GTM processes and areas for improvement. This allows businesses to be proactive rather than reactive when forecasting future trends, outcomes and areas for revenue growth.
Data provides revenue operators with a holistic view of your GTM motion and revenue performance, allowing them to create data-driven strategies and adjustments to reach revenue goals.
Looking for more insights? Our RevOps guide will help you establish a Single Source of Truth in your RevOps function!
Click here 👇